

 While working with clients to deliver EPM capabilities, we have all heard about how it is critical to have good EPM business processes in place within an organization. I would say that I totally agree with an earlier Column5 blog post, “The Process is King”. Clearly documented business process models assist organizations to align operations to their strategy, promote better communication, improve existing practices, establish control and consistency, and even gain competitive advantage.
Having worked on many SAP BPC implementations, I want to emphasize that excellent EPM processes can drive more value for an organization when combined with right technology to support EPM, such as SAP BPC. Therefore, a holistic view should consider the business/process owners, ‘best practice’ processes, and EPM technology that will support the business in achieving their EPM objectives.
As a SAP BPC consultant, how do I utilize process documentation while working with customers to design their EPM solution? I have found that the business process diagram is critical for the design as I prepare for the upcoming development and configuration effort in BPC. Undoubtedly, diagrams demonstrate in visual form how the EPM processes are to be executed by individuals or teams. This is an essential reference when detailing the system design and later when performing configurations.
There are many types of process diagrams available. In this blog, I will focus on the Cross Functional (swim lane) and Event-Driven Process Chain (EPC) diagrams as examples. I have used both on previous SAP BPC implementation projects. I won’t elaborate on the conventions to build these charts, however, I would like to highlight how the EPM process diagrams provide key details required for the development and configurations.
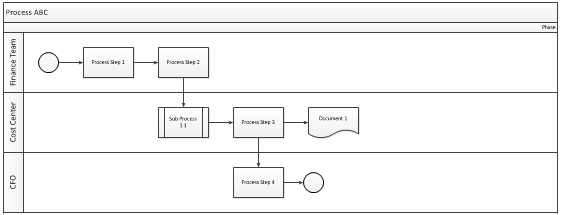
The Swim Lane Diagram is a cross functional flowchart to map an EPM process across the functional units of a business and it visually distinguishes job roles and responsibilities for the process steps.
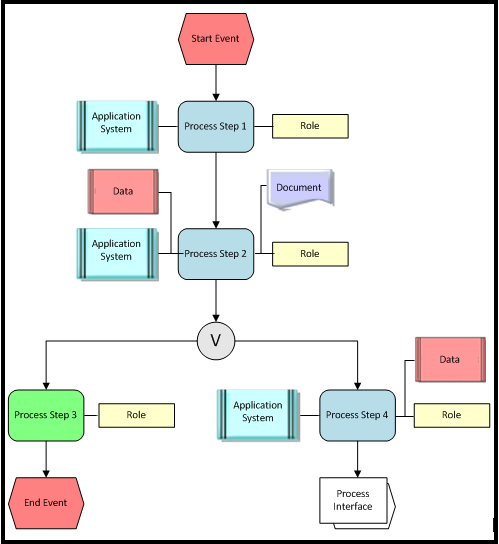
The Event-Driven Process Chain is an ordered graph of events and functions used for modelling, analysing, and re-designing business processes.
These process charts provide a lot of information that can be used as key inputs to detailed specifications, design decisions, data integration, and other artifacts needed in a SAP BPC implementation. By merely looking at the process flowchart, you can get a good idea how a BPC (BPF – business process workflow) workflow can be configured. What else can process diagrams be used for? Let’s see…
Process Step – This is the function or task that is being executed. Understanding the activity means collecting what objects and related items will be created to get it done (e.g. Business Rules-> Logic Script-> Data Manager to run cash flow, BPF template-> BPF instance for Annual Budget exercise or Web Report for manager’s review).
Role – Clearly highlighted in the Swim Lane approach, this is the person or group responsible for a set of process steps. The key BPC element in this area is actually identifying the type of security profiles to be set up for every role. What BPC tasks are related to the process steps? Any specific data access restrictions? It would even highlight if there is proper segregation of duties for internal control purposes.
There are also prerequisites when executing the process steps. It can be an event that needs to occur or object(s) needed to be received to be able to perform the activity. It’s very helpful to see all the inputs required to achieve the objective of the task. EPM process diagrams also identify when there is something produced as an output after completing the process step. These outputs can be either part of the business requirement, or sometimes are required as an input to a subsequent process step.
Data – It is important to determine whether the type of data is used as an input or output. This becomes the basis of the data specification and required integration. What type of data is required: master or transactional? Will the master data be reused by other processes (to be set up in BPC as a shared dimension)? Will it be sourced from SAP BW or another system? Will it be updated via upload or direct input? What calculations should be done by the system? When should they be calculated? Answers to the questions above guide EPM consultants in developing the design and choosing which SAP EPM functionality to use in order to meet the business requirements.
Reports and Input Templates – The inputs and outputs identified in process diagrams will often be designed as reports and input templates. Reports have data requirements that further drive data considerations in design. How should information be presented? Will the reports function dynamically or be static? Who is the target audience? These are just some considerations that get built into a complete design.
System Applications – While not prominently emphasized in other diagram types, EPC diagrams notably include the applications to identify tools/technology that supports the completion of process step. Finance resources often access various systems to validate period close results, perform analysis, identify market trends, etc. An understanding of the required applications in the process is critical to identify integration points. The solution design may require BPC to source data from multiple systems.
As shown in the examples above, there is a tremendous amount of valuable information that is provided in EPM process diagrams. This information is critical on an EPM project to facilitate the application design and implementation. To get the most of your EPM investment – marry ‘best practice’ processes that leverage the power of SAP's Enterprise Performance Management (EPM) suite, which includes BPC.
So if someone asks, how do you operate? Think, and go back to your process diagrams.
Want to learn more from Column5? Check out our events!

Related Blog Posts