Here in the Pacific Northwest of the United States, people are either “fair weather” campers or “all weather” campers. When I was a young Boy Scout, my Scoutmaster (a former Marine) could politely be described as an “all weather” camper. He had no regard for cold blowing horizontal rain or snow….we went camping anyway.  The best part of the trip was roasting marshmallows and drying out around the campfire, weather permitting. To distract all of us cold campers from turning it into a complaint party, he would engage us in games and stories. His favorite was the age old game of one person telling a story to your neighbor, and that person tells it to his neighbor and so on. Of course the story that is told by the last person bears little resemblance to the original story.
Turns out many EPM reports are designed the same way. At the start of an implementation a few reports are designed by key people and have the same look and feel. Over time as other report writers become involved and turnover occurs, the basic design look and feel starts to  rapidly change as the story is retold differently. Many rank and file users have told me that they are often confused how to use one report versus another as the look and feel is different. Inefficient at best, frustrating for the end user at worst. This common problem can be solved by use of a “Starter Kit” by all report writers.
What is a Starter Kit?
It is simply an Excel workbook which provides the report writer the standard tools and instructions to start from. Standard Starter Kit tools can include checkboxes, dropdowns, Macro buttons and other items. The instruction sheet provides the user with parameters to set up their report or input template. To prevent the “Campfire” phenomenon, the Starter Kit is “owned” by one or two individuals who are responsible for its design and content. Further the same individuals serve as the initial reviewers for new reports or templates, to ensure consistent design.
What a Starter Kit is not.
- The Starter Kit does not instruct the user how to use BPC. It will lead them through how to set up the specific report or input template.
- The Starter Kit does not have an EPM report already “baked in.”
Why use a Starter Kit?
- Providing a few basic tools will give report writers a quicker start than they would have otherwise. For example, the appropriate macro buttons can be chosen and can be dragged into the report or input template header.
- Having a common set of design parameters for report writers to use will give the end products a common look and feel, ultimately helping users more confidently move from report to report.
- As report or input standards change, they can be incorporated into the Starter Kit, so that users can begin incorporating the changes immediately.
Related Content: Demo of Column5 Starter Kit - NAU Budgeting Webcast
A well thought out Starter Kit should help the report writer create a reporting or input tool that leads the user through convenient choices. Let’s look at an example.

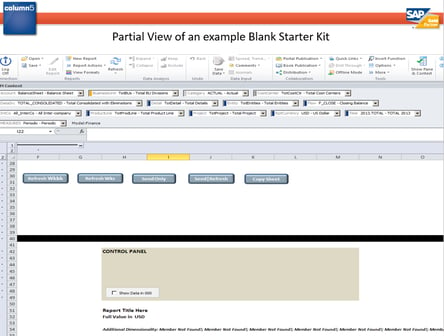
In the Starter Kit Example above (partial view), the report writer is provided with a standard format containing several tools to work with. The tools included will depend on what choices are made by the starter kit designer, but some of the ones included with the example are:
- Macro Buttons: The example shows five macro buttons to choose from and available to be dragged into the report. Each of these is tied to VBA code already embedded in the workbook. (Note the buttons all look the same!)
- Control Panel: This area is for dropdowns, checkboxes and other items which guide the user through specific choices. This area can be particularly useful when guiding the user through specific dimension member choices, or data display options.
- Additional Dimensionality: The Additional Dimensionality line shown is intended to show page axis dimensions and selected members. (Note if a member is not present, it displays a warning.)
The Instruction Sheet is one of the most important features of the Starter Kit. This provides the report writer with information on how to begin, what to use, standard colors, formatting standards, etc.
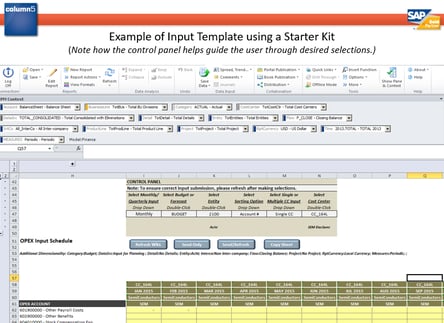
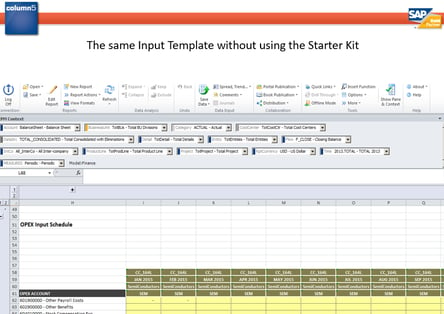
Now that we’ve seen an example of how a blank Starter Kit might look, let’s look at an input template using the above Starter Kit and one without.


Imagine yourself a new EPM end user. Which Input Template gives you a faster start? The Starter Kit based template guides you through dimensional choices, convenient send and/or refresh selections, as well as operational information. Also it probably looks and feels like the last template you used!
This is only one example of a Starter Kit. Depending on the organization, they can vary widely in complexity and degree of standardization. The best starter kits have been designed with general consensus of the user base as to what features are most important. As a general rule I have found that that the best report/template user experience is a result of 1) clearly communicated design which leads the user though report operation, and 2) minimum number of clicks to achieve the desired results.
Related Content: Customer Case Studies with Starter Kits
So avoid Campfire Report design and develop your own Starter Kit to improve the EPM user experience. And by all means……camp in fair weather!
For more tips like these that will increase your user satisfaction while lowering your cost of ownership, contact Column5 for a free consultation today!
More related content for you:
Blog Post: New Features of BPC 10.x Upgrades
Blog Post: EPM Execute API - SAP BPC
Blog Post: IT Best Practices for EPM Implementation Success
Training: BPC Reporting Workshop - Free Agenda Here
Webcast: EPM Reporting and Business Intelligence featuring Lumira
 Author Bio:
Steve Way has been a valued consultant at Column5 for over 3 years and is a debut author with this post. With decades of experience with EPM and its role in the financial processes, his abilities speak for themselves. In addition to EPM experience, Steve is an experienced entrepreneur and fisherman.
Steve Way, Consultant, US Team


