


 Long term BPC customers know that one of the tool’s key strengths, its powerful and easy to use reporting interface, can also be a challenge at inconvenient times. Over
the history of BPC’s reporting interface, dating back to OutlookSoft with venerable EvGet functions, relatively few changes have been made to the system.
However, when changes are made, some significant ripple effects can be felt. From 2000-2005, EvGET, EvSND, and EvEXP ruled the reporting interface. Then EvDRE was introduced, which reigned from 2005 – 2012. That is when SAP rolled out the EPM Add-in. The reporting interfaces have been revamped on roughly 5 year cycles, and now Analysis for Office (AO or AFO) is being groomed as the heir apparent for the EPM reporting interface of choice.
Long-term BPC users know there is a delicate balance between preserving the old for expediency’s sake and embracing the new to leverage the latest features. This will help you understand how to leverage this new reporting interface for your BPC deployment.
One of our first blog posts by Richard Hynes about Analysis for Office versus the EPM Add-in, discussed that the EPM Add-in and Analysis for Office are converging into a single add-in called the Analysis for Office Add-in. As of version 2.1, Analysis for Office Add-in contained two separate plug-ins: the EPM plug-in and the Analysis plug-in. And when version 2.3 was released in mid-2016, a third plug-in was added – the BPC plug-in.
The BPC plug-in allows you to execute and monitor the Microsoft Excel or PowerPoint activities and tasks associated with Business Process Flows (BPFs). Prior to this version of Analysis for Office Add-in, BPF activities were launched, marked as completed/rejected, or monitored from the SAP Business Planning and Consolidation web client. The actions were generally completed in Microsoft Excel input templates and reports. This resulted in users having to constantly toggle back and forth between the web client and Excel interfaces when moving through a BPF.
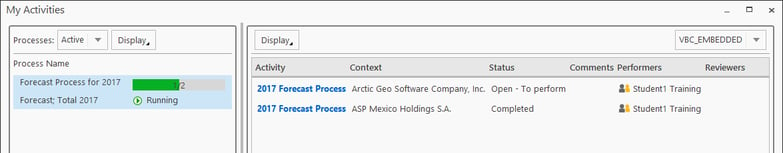
The My Activities page in the SAP Business Planning and Consolidation web client. This page can still be used as the main user interface when working with Business Process Flows if you do not have the BPC plug-in installed.
The Analysis for Office BPC plug-in resolves this cumbersome navigation issue with a built-in Activity Pane that sits directly on top of the Excel or PowerPoint interface – so there’s no need to toggle between the web client and Microsoft Excel when performing actions such as opening an input form, running a data manger packager, or setting work status.
The Activity Pane in the BPC plug-in. In order touse this plug-in, you must have BPC NW 10.1, SP10 or greater.
Within this Activity Pane, you can launch and work with an activity workspace, mark a process as completed/rejected, view and manage all activities assigned to you in the My Activities window (below), and review the current progress or status of a process using the Process Monitor.
The My Activities window (shown below) and the Process Monitor can be launched from the bottom of the Activity Pane. From the My Activities window you can view and open all activities for an assigned process
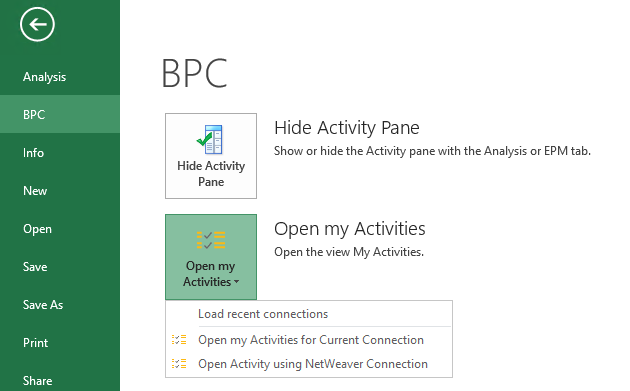
Now, if you are familiar with the most current version of the Analysis for Office Add-in you may already know that this presents a minor issue when it comes to screen real estate. In a given Excel session, you could be connected to multiple data sources and have both the Analysis Design panel (Analysis plug-in) and the EPM Pane (EPM plug-in) open at the same time. With the addition of the activity pane, you could now have three panels open at the same time! Unless you are working with a large monitor, you could end up moving and resizing panels and columns constantly, rather than focusing on process activities or the analysis data in front of you. Fortunately, the Activity Pane can easily be hidden or shown from the BPC menu in the backstage view. From this menu, you can also open or load activities from a current or Netweaver connection.
The BPC menu in the backstage view allows you to quickly hide/show the Activity Pane.
As you can see, there have been quite a few updates to the Analysis for Office Add-in, and with the recent addition of the BPC plug-in, things are starting to become more business process-friendly and easier to navigate with this centralized interface approach in the Excel and PowerPoint interfaces.
Keep checking back here for more updates and insight into the Analysis for Office Add-in! If you are considering a new implementation or a migration to one of the BPC versions that uses the Analysis for Office add-in, please contact us for assistance.
Did you know? EPM Academy offers an Analysis for Office eLearning course!

Related Articles:
EPM Add-in Tips, Tricks, and Reporting & Analysis Best Practices
SAP BW-IP, SAP BPC NW 10.1 Standard and SAP BPC NW 10.1 Embedded Compared
6 Commonly Asked Questions About the EPM Add-in Excel Client
 Author Bio:
Adam Hess is on Column5's SAP EPM Curriculum Developer and Trainer. With over a 100+ classroom deliveries, Adam knows how to design, develop, and deliver live and virtual classroom environments. His current training and eLearning development expertise includes SAP BusinessObjects Planning and Consolidation 10 and 10.1 (Reporting and Administration) for both Microsoft and NetWeaver versions. He has been with Column5 since 2014.