 Whether I am in a development role or supporting a solution I am often faced with the task of identifying why an EPM report or input form is not behaving as expected. Regardless of who originally created the content and whether or not you have any background information on how it was configured there are many transferable troubleshooting techniques that can be executed in order to uncover the root cause of a problem. I will cover what areas you should consider investigating to uncover common issues.
A word on performance overall…it is important to remember that the performance a user perceives is the sum total of all decisions made in the solution deployment to date. This includes the way the project was envisioned and conducted, as well was what went on throughout the project including the design, the way the deliverables were developed, how hardware was configured, and how the system is used. All of these can impact the way performance manifests to the user, and a performance problem is a very serious situation that simply won’t get better on its own. If you are afflicted with a performance issue, it is important to manage the situation to get a good understanding of what is causing the problem and have an effective plan to address it. Column5 offers EPM Assessment services to address just this type of issue.
Before diving into mechanics of the report first we should consider if we are evaluating an existing report that has already been tested and released into production or if it is a new report being developed. Is the problem only happening to a single user or can it be reproduced elsewhere? It’s easy to point fingers at a report displaying undesirable symptoms, however there are many factors to consider such as system set up, EPM version, BPC environment, user security and model or template configuration. If it was working before and now it’s not then we must identify what has changed. If it is a new report then we need to verify that it is utilizing supported features and is set up correctly.
User specific questions to ask…
Is the user experiencing the issue on the latest support pack and supported platform? Are there any conflicting add-ins enabled? Are they running multiple instances of Excel? Can the problem be resolved by clearing and refreshing their metadata cache? Do they have the necessary user rights granted? Sometimes these are difficult conditions to isolate given environment complexity. Consider contacting qualified professional services teams with specialized skills like Column5’s Technical Services team.
The problem can be reproduced by multiple users, so what’s next?
After you have ruled out system factors, such as software and EPM version updates, we need to determine the type of problem. Is it data related or a loss of functionality? The BPC Administrator can check the status of the Data Manager Packages ensure the jobs have successfully completed or should be aware if something in the model has changed such as a property or property value, or a new or missing member. In the case of a new report that has been migrated from one environment to another, verify all dependencies have been migrated too. Ensure script logic or BADI code has been validated, executed and had results tested. Once all underlying factors appear sound it’s time for a technical inspection of the report template in question.
The template is deemed “broken”, now open up the hood…
Log Files
With the troubled input form/report open, on the EPM Add-in navigate to More > Log. This will show any high level information about report errors and the bottom of the screen will display the file path where the log files are stored.
Connections
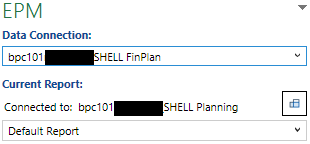
Within the connection manager you can access report connections and see what is being utilized by any connection and change them if necessary. Accessing the report editor will also display what the current selected EPM report is connected to at the bottom of the layout tab. Show the EPM Pane to see the data connection you are logged on to in comparison to the current EPM report selected. Take note of the server name in addition to the environment and model, which can be helpful to validate a migration. The report connection could be different to the server or model where the file is saved.
Review the EPM Layout
How are members for each dimension defined? Are they being used in an axis, reading from context or is there an override? If a dimension is not being used in any axis, including key date (applicable if there are time dependent hierarchies), it will default to the context selection so check if has been locked or is user selectable as this will impact the result set. An override can be defined by an EPM function (look for EPMDimensionOverride, EPMAxisOverride) or a member in any axis with an EPMOlapMemberO formula referencing another cell.
To identify if there are multiple EPM reports on a single sheet go to the connection manager and look at the report connections, or look in the delete reports list under report actions menu item on the EPM Ribbon (use caution here). You can use the EPM Pane to highlight the outline of an EPM Report, then look in the formula bar of a member on any axis to identify which report is selected based on the unique identifier code (i.e. “000”, “001”)
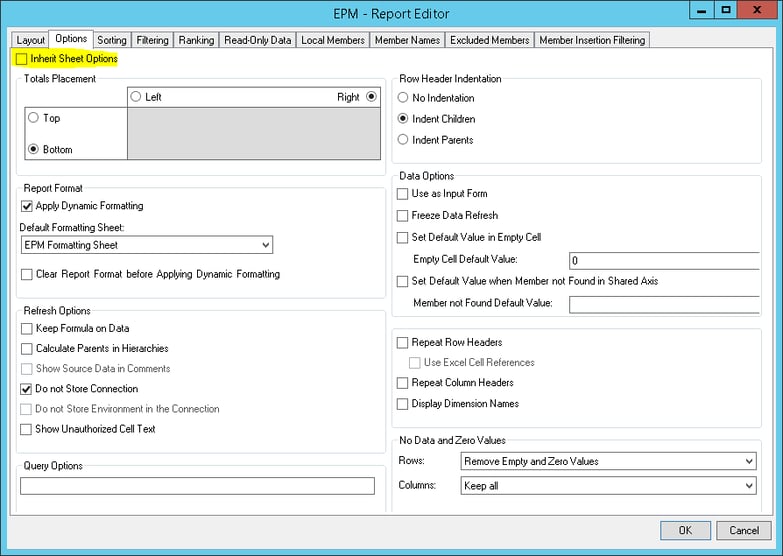
A common oversight is how EPM report options are set. While everything may appear to be set up correctly in the sheet options (i.e. use as an input form is checked, formatting sheet enabled/selected etc), if it’s not behaving as configured there then it’s probably not set to inherit them and has its own unique options defined in the report editor.
Follow the EPM Formatting Sheet Rules
When there are conflicting rules defined for a particular intersection, priority is given to the setting displayed in the lower section. Ensure the ‘Apply’ checkbox is used only where necessary and evaluate if the ‘Use’ column is needed for both the data and header. Row headers may already have a default format set in an above section so only a data format for a particular rule is needed lower down. When a format is copied and pasted from one rule to another it doesn’t inherit all the EPM options set on the right-click menu (protection, data validation), so this is often the cause of unprotected cells in non-imputable intersections. If there is a content override in use this could explain discrepancies in local member formulas.
Nifty Native Excel Features
Believe it or not, the EPM Add-in for Excel supports native Excel functions! Use them to your advantage.
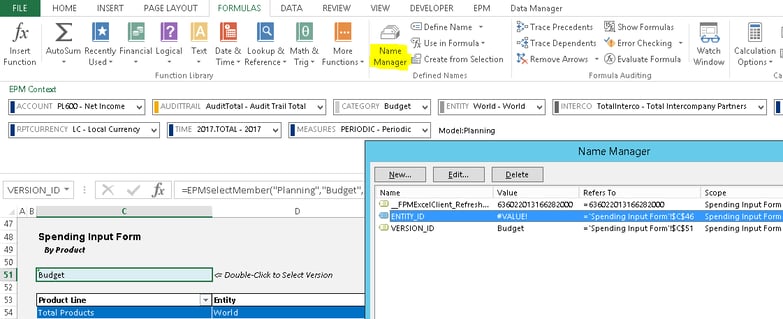
Set the view to show formulas and headings (unhide rows and columns) and unfreeze panes to expose all cells while trouble-shooting. Tracing precedents and dependents is useful in following cell references often used to generate a dynamic member or member set. The name manager displays all the named ranges, useful for navigating formula dependencies and can highlight any value errors due to an invalid formula or reference.
Look in the conditional formatting manager to see if any rules have been applied on either the EPM Formatting Sheet or the worksheet containing the EPM report. Conditional formatting applied to the EPM Formatting Sheet can cause performance impacts as each cell is evaluated for the rules.
If there are developer objects (i.e. form controls) used, the selection pane is useful in locating and organizing them. Reviewing their properties can help determine their behavior and if there are any macros associated with them.
VBA
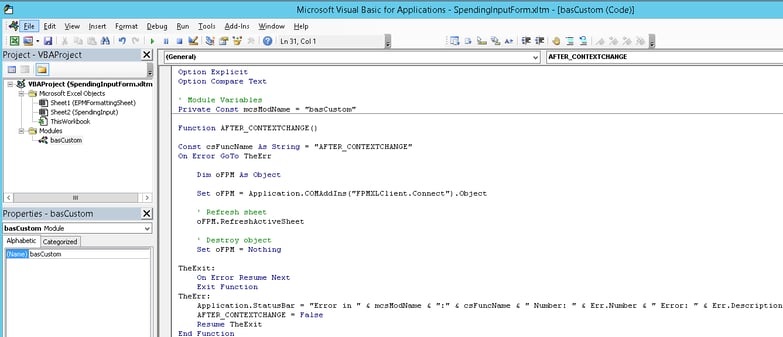
Some reporting solutions have custom VBA code written to control specific behavior when certain events occur, such as before or after a send or refresh action, or after a workbook open or context change action. It is important to evaluate whether your organization has the ability to maintain such code before implementing it. To identify whether it is being used access the Visual Basic editor from developer ribbon or Alt+F11. Compile the project, set break points, run the code and step into it. Search for ‘FPMXLClient’ to see what EPM references are called. It is helpful to locate an error if the developer has added error messages to bottom of each function and display them in the Excel application status bar capturing the module name, function name and error message.
Conclusion
Many varying factors contribute to working systems, so while this while this is not an exhaustive list covering them all, it does address many common problem solving areas that are worthwhile exploring to accomplish an efficient resolution. If you require assistance related to a specific case please reach out to our Technical Services department for support. Our EPM Academy also offers BPC Reporting workshops both in Scottsdale, AZ as well as Manchester/London, England that cover topics referred to in this article in more depth.
Related Articles
6 Commonly Asked Questions About the EPM Add-in Excel Client
SAP BPC Reporting Tips & Tricks
Useful Tips of Advanced Functionality in EPM10 Dynamic Formatting
Using the Power of Visual Basic in EPM 10 Reporting
Author Bio:
Lorelle Gibson has been with Column5 Consulting as a Senior Consultant since 2009. After years of experience implementing SAP BusinessObjects BI she began integrating it with SAP EPM and has delivered many successful SAP BPC solutions.


