If you have not read part one of this blog, read it here!
3. Performance Tuning
 Once we have a System Landscape Design complete, yielding proper hardware sizing for the server and client, we should do Performance Tuning. I always say in the 40 hour class I give for “Technical System Administration” that this is not a one and done processes. This should be performed monthly, quarterly, before major planning cycles, and/or yearly during the “end of period” financial process (that’s why it’s important to have at least one trained resource on your team who can perform this task in-house, with limited support). This is a concrete example of how being internally capable to tune your own environment’s performance is a great way to boost user satisfaction and lower TCO. Contact us about our Technical System Administration class to equip your team with this capability.
I speak to a lot of customers who believe that no one can really know why BPC performs well or poorly. They perceive the system as a black box, so naturally achieving good performance requires some black magic that only those with rare skills have. When you’re in the dark, everything looks black. Black box, black magic…and soon, customers in this state will swear there’s a ghost in the machine that is haunting their performance.
The truth is, with the right knowledge, the system’s performance timing can be observed and specific explanations are available with great detail. We always want to start by looking at performance during the busiest times using Microsoft built-in processes, or use a performance load simulation tool like “HP Load Runner” with the “SAP BPC Load Runner Toolkit”. Some of the built-in processes include Microsoft Windows “Data Collector” sets, SQL Server Reports, SQL Server Profiler, and Database Tuning Advisor. Most of these items are available after Windows 2008 and are still available in Windows 2012 R2 (latest supported with BPC 10/10.1).
a. SAP BPC Load Runner Toolkit – This is available from SAP for the NW version of the product only, but Column5 Technical Services has found a way to use this for the MS version. In conjunction with Fiddler (free on the internet), you can record the functions being performed on the client machine, feed it into the SAP BPC Load Runner Toolkit, and save the information. The toolkit will scope the work being performed, and format it for use with HP Load Runner. Once complete, you feed that into Load Runner (available free for 50 concurrent users), and along with some other work, it will mimic having 50 users in the BPC system and putting a load on the servers. This is an automated way to performance tune BPC servers and client software.
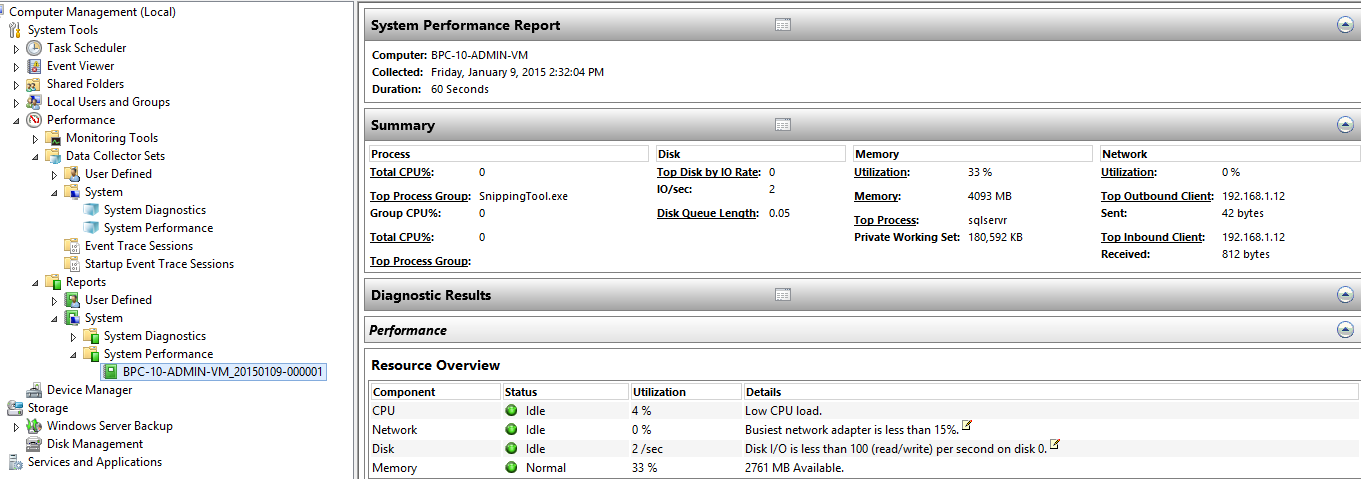
b. Windows Data Collector Sets – This is a performance tuning process that is built into Windows, and will record server performance parameters related to disk, RAM, CPU, Network Traffic, and other aspects of server performance. This can be customized to look at SQL, Analysis Services, and IIS performance. The best part is it will automatically create a report, and highlight areas of concern in red. This is a great way to look at the items mentioned above, and allow you to move data files, and increase Ram, CPU, and other aspects of the server to improve performance. The Data Collector Sets can be run on a schedule so you can look at server performance during busy times, and review the report once the process is complete.

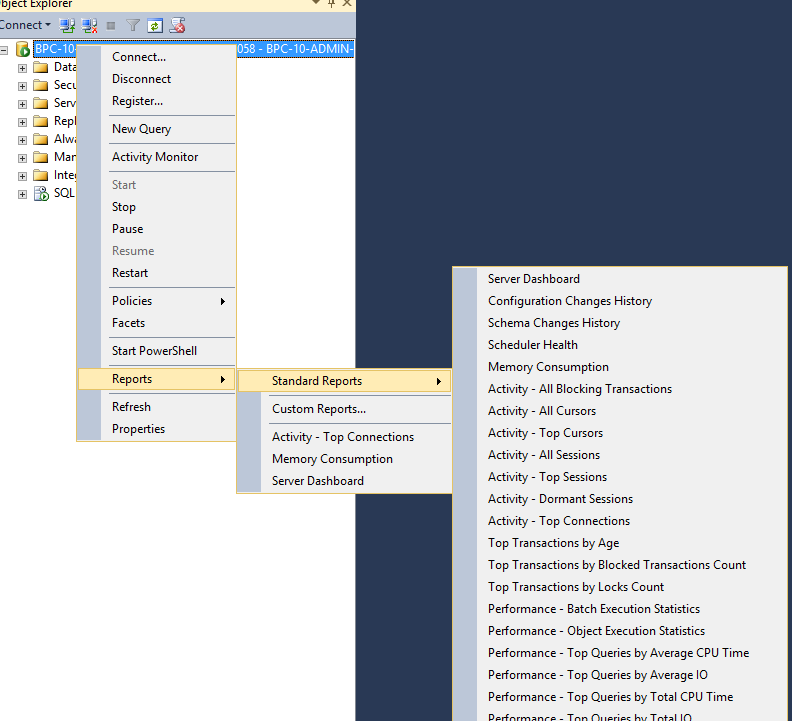
c. SQL Server Reports – These reports are built into SQL Server. You just right click the server name in SQL Server Management Studio, and choose Reports>Standard Reports, then pick one of the 23 available. You can find information on largest queries run, memory consumption per query or on the server as a whole, top queries by CPU or memory consumption, among many others. These are a great way to understand what is happening on the SQL Server with SQL specifically, and can point to additional needed hardware resources.

Whatever system you use, these reports will provide you with empirical data that reveals what performance challenges may be going on in your environment. Once you identify the cause, you can address the problem.
4. SQL Indexes
SQL Server Profiler and Database Tuning Advisor – These two built-in products can be used to find additional statistics and indexes that will improve SQL Server Performance. You can create any statistics you want within the BPC database, but indexes are another story. There are actually 2 indexes that can be customized within the BPC system that will be built on the fact tables each time a user in the Administration module chooses to rebuild or update them during the Optimize or Modify cube processes. You add these custom index parameters in the Administration module for “Set Model Parameters”. These indexes would be per model (each fact table), and should be added with a comma between each column you want included in the index with no spaces in between each. You record the work being done by SQL Server with a Profiler Trace using the built-in tuning template, then feed the resulting recorded files into Database Tuning Advisor. This will give you the index column name and order it thinks will help performance the most. By default, every single customer in the world has the same exact fact table indexes (Category, Entity, Time, Account, and RPTCurrency), but shouldn’t. These custom indexes include:
DimsForFactTblIndex –The Fact and Fac2 tables use a clustered index, while the write-back table uses a composite index.
CustomFactTblIndex – The Fact and Fac2 tables use a non-clustered index, while the write-back table uses a composite index. Client best practices.
5. Analysis Services Partitions
Analysis Services Partitioning has always been available in the BPC product. The advantage of partitioning is two-fold: First, it allows for a “cache” to be created per partition, and second, it allows for much quicker retrieves and model processing. In past versions of BPC, it was a manual process that required some work to complete, and constant changing as the system was being used. SAP has since built a web page (Partition Wizard) that is a drag and drop process. Analysis Services Partitioning can improve retrieval of data for the user and quicken Model Processing (Optimize or Modify Model or Process Model during dimension updates) by up to 50%! Every single customer should be using this process to achieve maximum performance for data retrieval and processing. We want to partition the database based on data that is going to change and data that is static. As an example, say we have a time dimension that is 5 years, and the data may change back for 12 months. The partitions should be created as one for each month of the data that will change, and one partition for all other months combined.
I hope these blog posts have provided you with some useful approaches to take to improve the performance you are experiencing. Some customers quietly tolerate poor performance (some not so quietly), and I believe there is no reason why any client should be struggling with bad performance. I encourage you to try the above suggestions, and if you do not feel qualified or comfortable enough to attempt these techniques, please do give us a call. We are passionate about BPC and would love to help you get your experience with the product to where it should be.
Do not accept poor performance!
Related Articles:
Service Pack 9 for BPC v10 NetWeaver
BPC NetWeaver Change Management
5 Things to Get the Best Performance from Your BPC Microsoft 10.x Server Environment - Part 1
What's New for EPM - A Look at the Latest EPM Roadmap from SAP
Performance Tuning for SAP BPC 10.0 for NetWeaver


