


As many of you know, a properly implemented EPM solution can help model changing market conditions.  Such
Such
conditions may be commodity prices, competitive pressure in certain product and geographical markets, interest rates, or currency exchange rates. The thinking is, the better the ability to understand the impact to your organization of such volatility drivers, the more time you will have to craft a strategy to react. However, this task is not very simple as you will have all of those influences (and likely many more) nudging your company’s performance indicators up and down simultaneously.
How do you isolate the impact of one influence to have a clear understanding of the weight of that particular sensitivity?
This blog article will examine one such market influence we may all be familiar with, currency. A recently experienced example of volatility is a drop in the value of the Pound Sterling against most other currencies; mainly as a reaction to BREXIT.
BREXIT Example of Volatility & Variance:
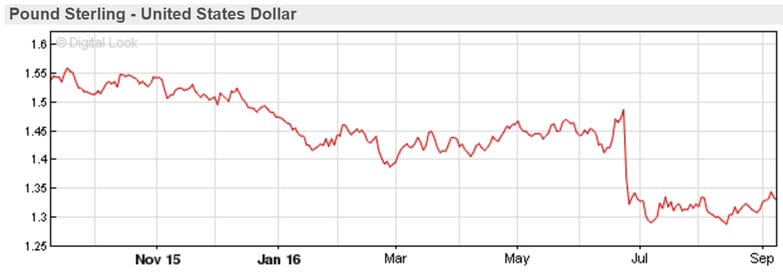
The GBP – USD rate has moved within a 20% band over the last year of which half was directly tied to the BREXIT vote. In addition to making the UK a bargain holiday location the currency fluctuations have an impact on financial reporting.
Let’s start by examining a simple sales variance. In practice this would be performed on the whole Income Statement.
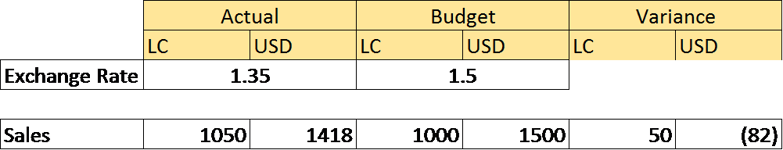
The variance in local currency is favourable (+50) but since the budget was agreed the exchange rate has fallen and this has resulted in an adverse variance (-82) in USD.
We need to be able to present the variances so that it is visible how much of the variance is driven by Operational influences and how much is an Exchange variance. To do this we need to calculate the variance at a constant currency exchange rate. The missing ingredient is the Budget data translated at the Actual Exchange Rate. We can then identify the variance between Actual and Budget data at a constant rate, the Operational variance. The variance resulting from exchange rate movements, the Exchange variance can also be calculated.
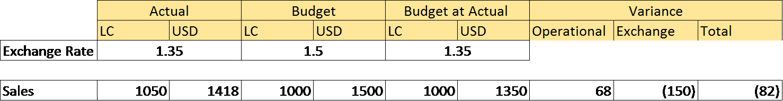
In this case we have added in the calculation of Budget at Actual. We can then analyse the variance:
Operational Variance = [Actual] – [Budget at Actual]
Exchange Variance = [Budget at Actual] – [Budget]
The Operational Variance is the difference between Actual and Budget but with both at the Actual Rate. The Exchange Variance is the difference between translating the Budget data at Actual against Budget exchange rate.
If you want to compare Actual with Prior Year Actual (PYA) then you may add PYA at Actual to provide the variance analysis. In all cases the key is to be able to analyse the variance at a constant Exchange Rate to calculate the Operational variance.
You may ask why the Actual Budget variance analysis couldn’t be done using the Budget rate as the constant rate?
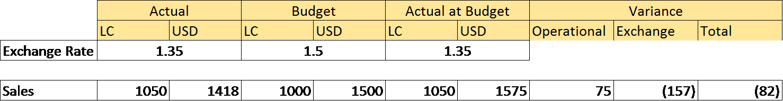
Of course it can; the variance analysis may differ slightly, as there is a cross variance, but the principle is the same.
In deciding which rate to hold constant we have found that the amount of processing is minimised by using the most current rates as the constant rate. In the examples above we had three data sets to convert.
Budget at Budget Rate - Currency translation run once
Actual at Actual RATE - Currency translation run when local currency data changes
…. and one of these:
Actual at Budget Rate - Currency translation run when local currency data changes
Budget at Actual Rate - Currency translation run once
You will see that by using Budget at Actual Rate as the constant currency we eliminate the need to retranslate the Actual data at both Budget and Actual rate whenever the Local Currency data changes.
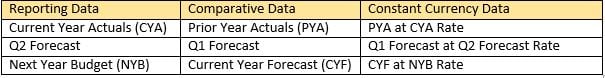
Other sets of data which would typically be used for Constant Currency reporting could include:
So how would we configure a BPC model to deliver Constant Currency Reporting? Let’s take the first example above.
On the assumption that we already have Categories for Actual and Budget which are translated at Actual and Budget rate respectively, the first step will be to create a new member in the Category Dimension, BUD_ACT (Budget at Actual Rate).
We could then populate the BUD_ACT category by following these steps:
- Copy Local Currency Budget data from the Budget Category into the BUD_ACT category.
- Copy Exchange Rate data, in the Rate model, from the Actual Category to the BUD_ACT Category.
- Run the FX logic on the BUD_ACT category.
This approach will produce the required data but has some implications on data storage and requirements for manual data management.
- Local Currency Budget Data and Actual Exchange Rates are held twice in the BPC database.
- If Budget data or Actual Exchange Rates change, then the relevant copy must be repeated.
- Procedures need to be in place to ensure data integrity in case of changes in the data.
If you are using FX Business Rules, however, these allow the behaviour of the Constant Currency Category to be defined by properties.
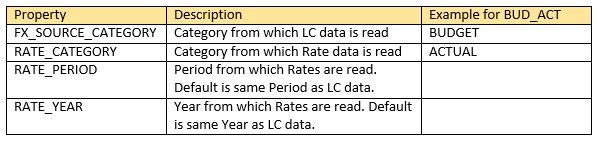
Using the Category dimension properties to manage the data would result in the Reporting Currency data being populated in the BUD_ACT category based on the LC data in the BUDGET category and the Exchange Rates in the ACTUAL category. The LC data and the Exchange Rates would not be copied into the BUD_ACT category, reducing data storage and the complexities of keeping the data aligned.
If you have any thoughts or questions on the approach to constant currency reporting outlined above, please add your comments below.
Column5 have extensive experience in the design and implementation of constant currency reporting solutions, so do not hesitate to contact us for assistance.
BPC 10.x Reporting Workshop
14 - 16 November
Manchester, UK
Column5’s interactive three-day, BPC 10.X Reporting training gives users a comprehensive toolbox for building dynamic reports and input forms in the EPM Add-in for Excel. Our training, applicable to both the Microsoft and NetWeaver platforms for BPC 10.0 and BPC 10.1, begins with basic reporting considerations and moves onto advanced reporting topics. With the tools to efficiently use the EPM Add-in for Excel, users have more time for analysis and spend less time mechanizing spreadsheets.

Read more related content:
Quick Wins in BPC Logic Tuning
Momentous Events in London this June - Even for SAP EPM users
3 Key Findings from the Close Cycle Rankings 2016 You Need to Know
SAP BPC Reporting Tips & Tricks
Author Bio:
 Martin Lloyd is the Implementation Director for the UK (EMEA team). A solutions architect and Chartered Accountant with over 20 years' industry experience with Enterprise Performance Management. He is an internationally recognized expert in the design and implementation of Enterprise Performance Management (EPM) solutions. Certified in SAP BPC 10 and HANA.